
Enterprise Dashboarding
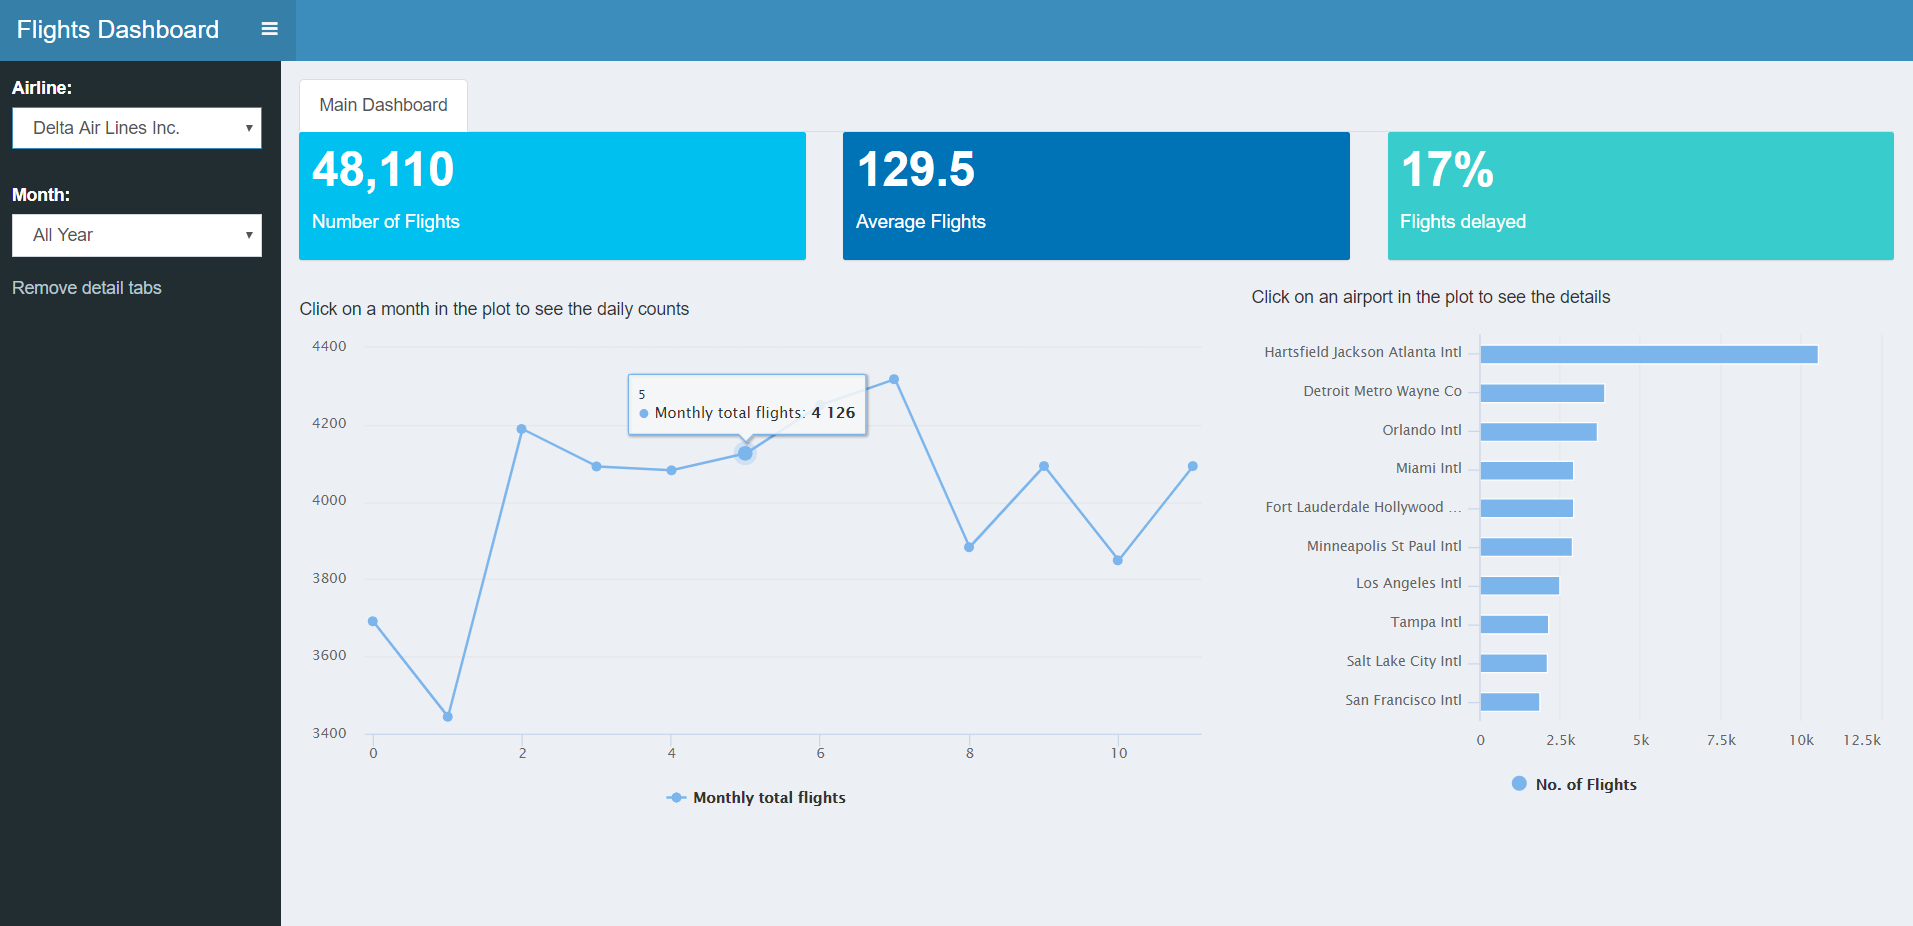
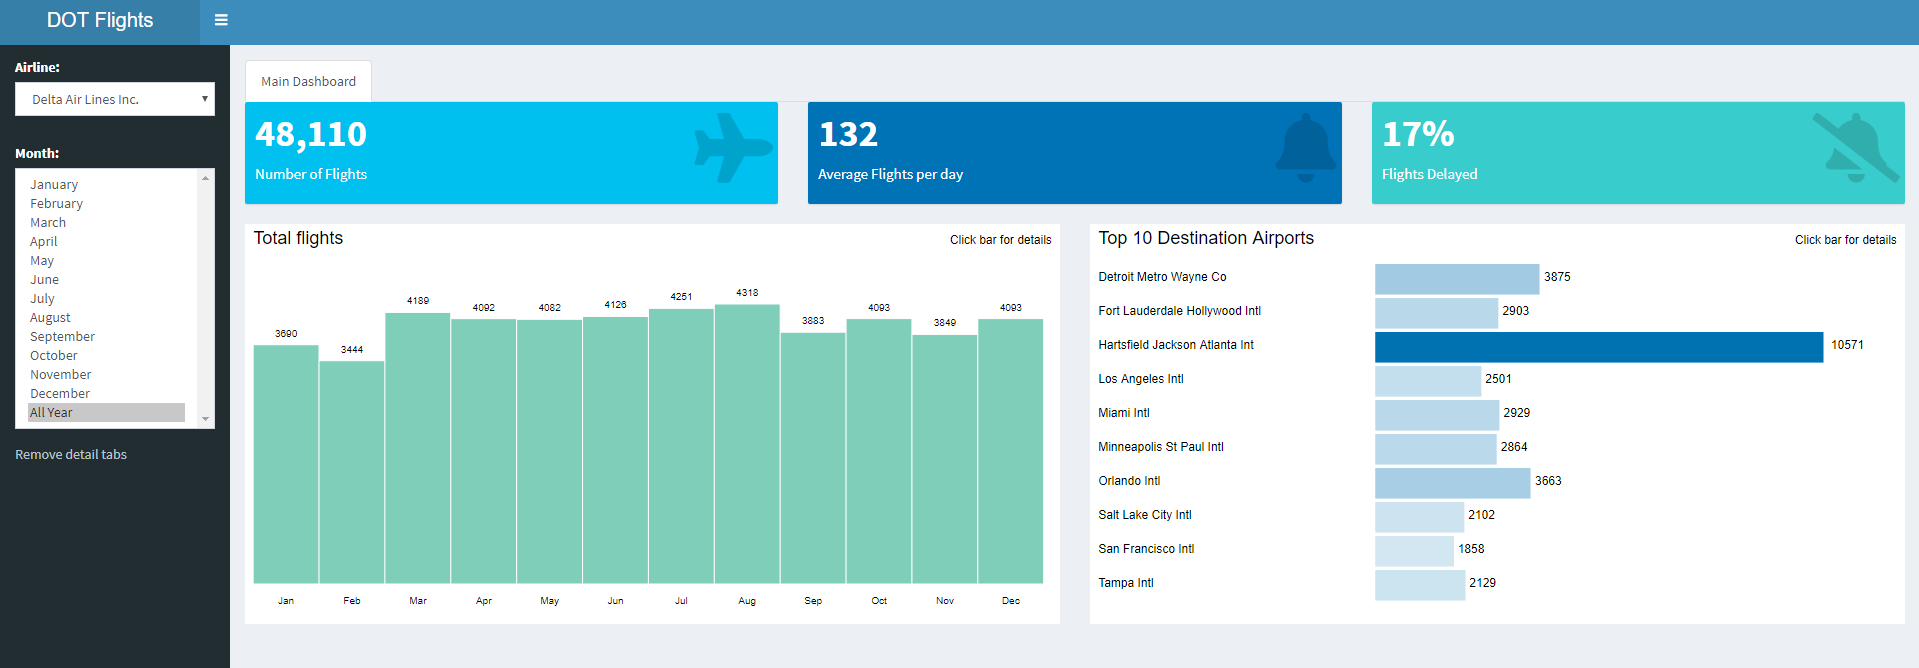
An Enterprise Dashboard is an effective tool for management team/executives to get a top level view of their enterprise by extracting and generating KPIs from their enterprise software systems. An effective Enterprise Dashboard offers decision makers a single view of the metrics being monitored in a user-friendly manner. - Check out this enterprise dashboard shiny application https://denironyx.shinyapps.io/caflights15/
Enterprise Dashboarding
A few big numbers (people like big numbers, right?), a couple of charts, maybe a table. In theory, all these elements tell a coherent story to the users, why they can act on. However, the reality is a bit different.
Everyone sees the dots, but few people are able to see the big picture behind it. Why? Data is quite complex and we ask users to connect all the dots themselves to see the full picture.
There’s usually a reasonable explanation for that complexity in enterprise software. Hard things are hard. There’s an inherent complexity in complicated domains like government, healthcare or marketing. But, you shouldn’t need to have a Ph.D. in data science to be able to read a dashboard, right?
In today’s fast paced business environment, organizations need to be agile to overcome challenges and match-up with growth opportunities. With disparate enterprise systems in place, data within the corporate is rapidly growing. Being able to get actionable information by employees at the right time, from anywhere in a secure manner is the key to business success. In such a scenario, an Enterprise Dashboard will improve the lead time and quality of decision making.
Why do Enterprises need Dashboards?
Every business user in an enterprise is tasked with understanding corporate goals and objectives. They need to manage their own department, division or team to achieve the goals set by the management team. However, there is never enough time to sift through spreadsheets, presentations, reports and enterprise systems or databases to find the information needed to make the best decision. Moreover, not every user has access to all the information that is required to make those decisions.
Dashboards enable true assessment of business and performance. It provides clear, concise results using data integrated from various sources and is presented in a way that clearly illustrates patterns, trends and pain points that require attention. With custom designed metrics and measurements, executives and business users can manage accurately, the insights into the Key Performance Indicators (KPIs) they establish. This enables enterprises to make faster, more accurate, course corrections and adapt to the changing market and business landscape with ease and proficiency. These kinds of dashboards are executive dashboards.
The Key Benefits of Enterprise Dashboards
Typically, enterprises enable dashboards for executives and managers. However, Dashboards are useful across any functions. Some of the other types of dashboards are based on departments and industries which include – Marketing, Sales, HR, Operations and Finance. Business Intelligence Dashboard and CRM Dashboards are also popular. Dashboards need to be customized for each function within an organization. Some of the key benefits of these dashboards include:
- Graphical presentation of real-time data
- Ability to generate detailed reports for multiple levels
- Improves productivity by providing faster access to information
- Ability to make more informed decisions based on collected business intelligence
- Gives complete visibility into all systems instantly
Important Elements to Consider while Implementing a Dashboard
Once you have decided that you would like to enable Dashboard for your employees, based on our experience and customer requirements, here are some of the parameters you will need to identify before developing a Dashboard to be in-line with your business goals and strategy.
- Relevant KPIs: A Dashboard is most effective when the most relevant KPIs are displayed. Often organizations have many KPIs. Therefore, the first step would be to identify the absolutely important KPIs.
- Usability: When it comes to using a Dashboard, generally one size does not fit all. Though the KPIs may be the same, each set of users would like to view the data represented in a specific format. Therefore it’s recommended you brainstorm over what and how user would like to view the data.
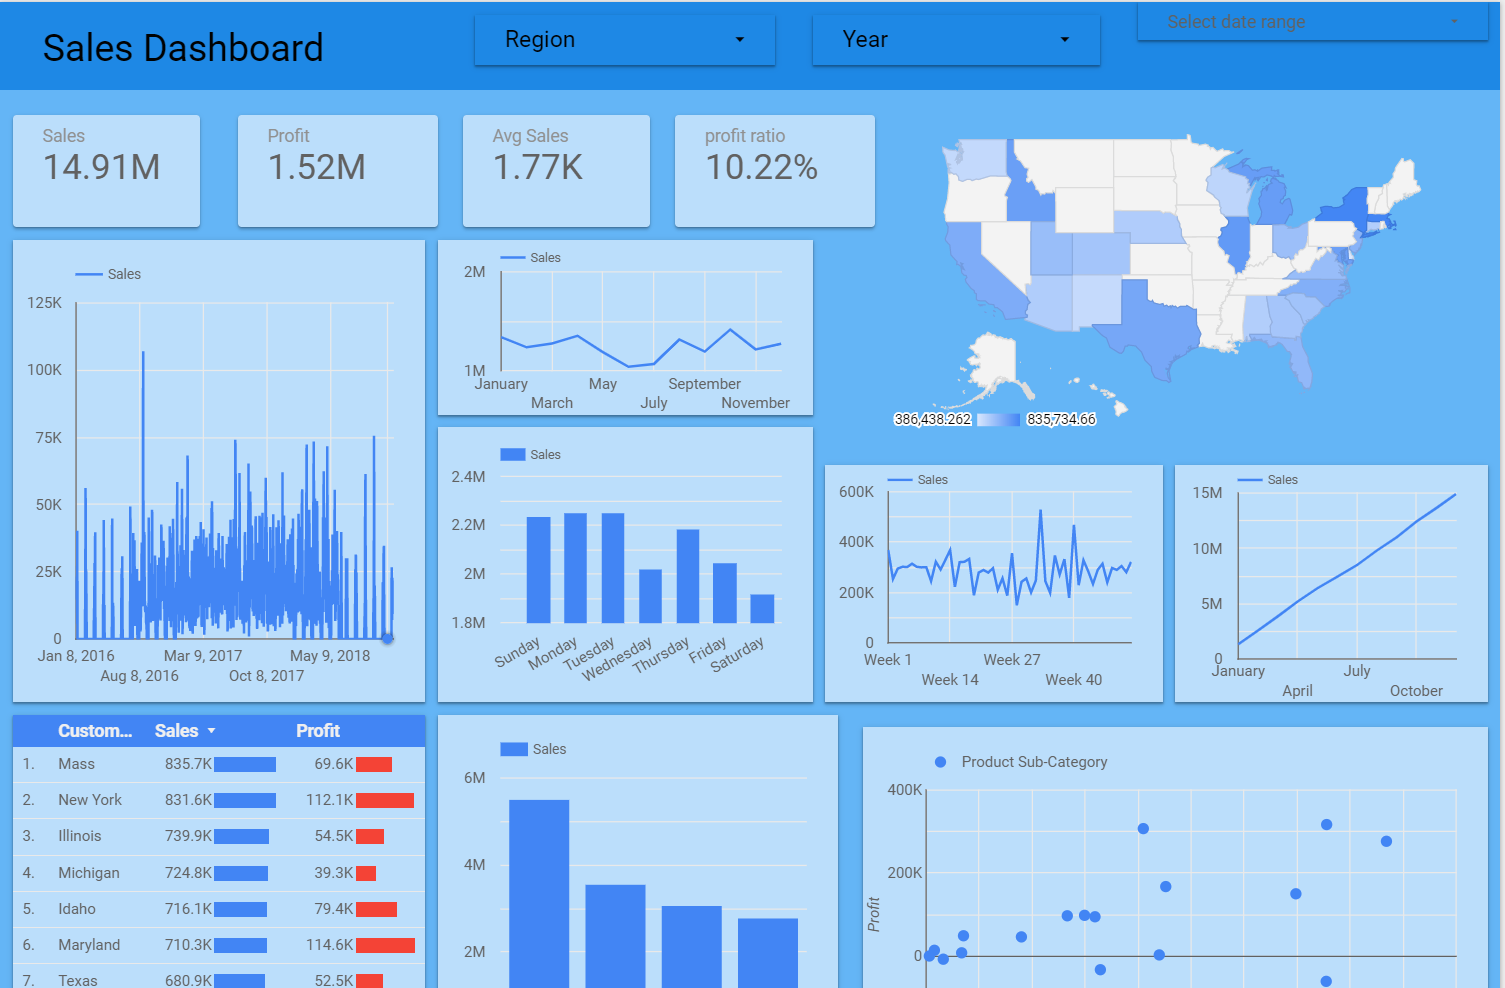
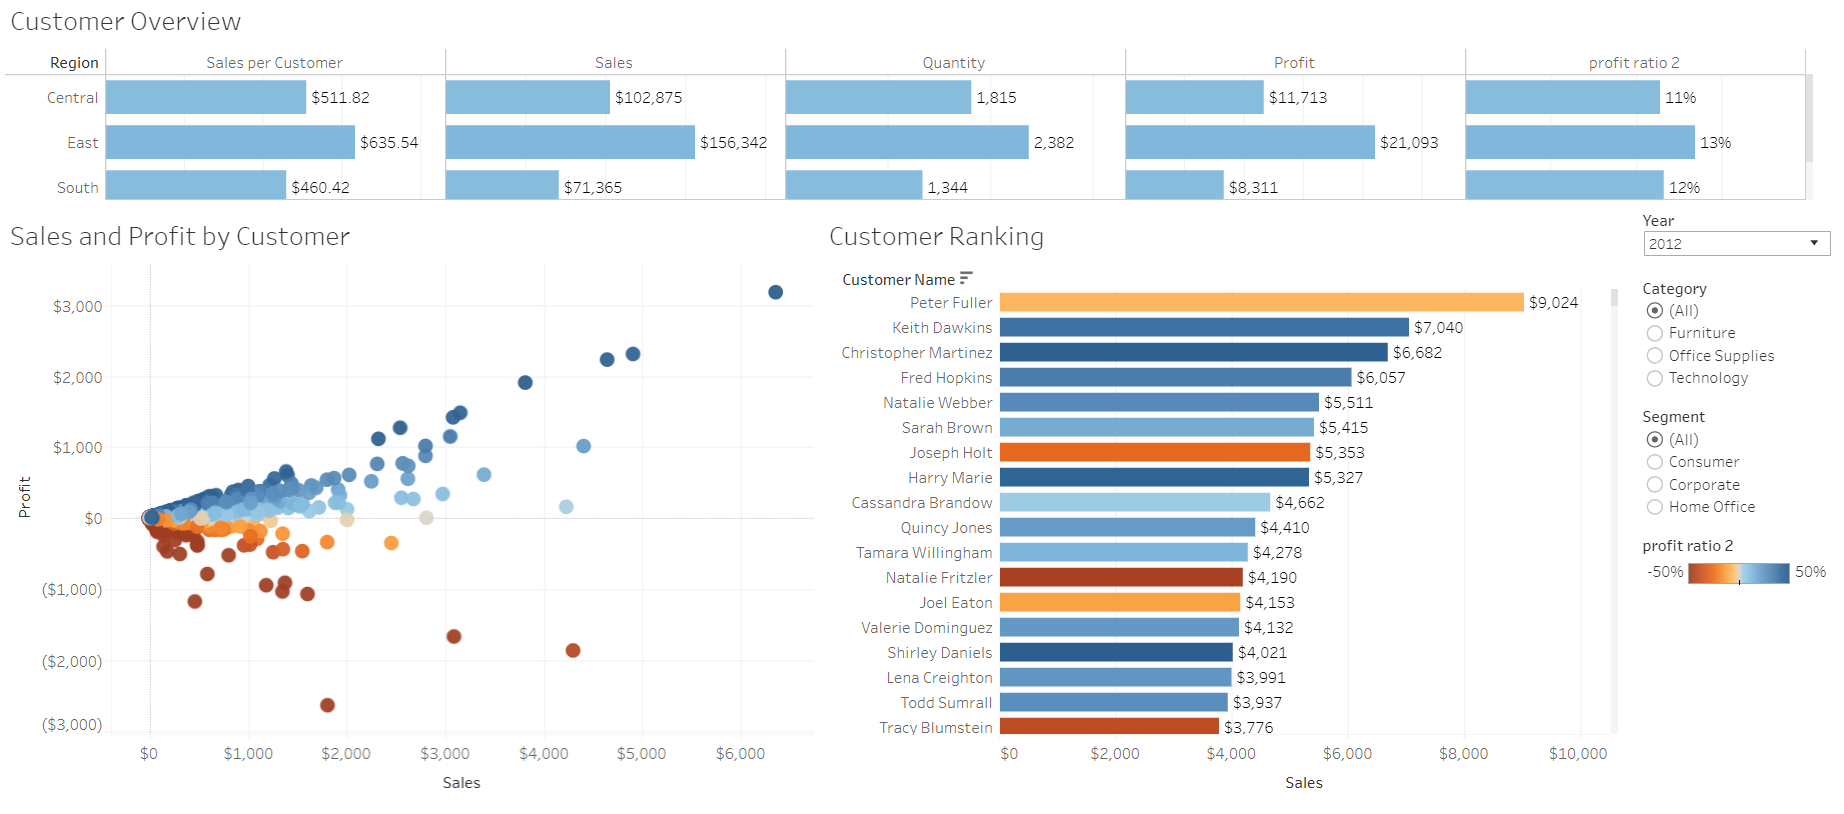
- Visual Display: While building a real-time Dashboard, visual representation of data is useful to easily identify trends and pain areas. Graphs, Pie charts, Funnels, Geo Maps, Heat Maps, etc. all have their own advantages in various scenarios. Therefore, include some kind of graphical charts into your dashboard application.
- Analytics: Smart Dashboards are more of a convergence of typical dashboards and scorecards. It is important to enable analytics to identify trends from historical data. Enabling simulation scenarios (What If Scenarios) to get some view into the future will add more value.
- Back End Systems Integration: To access corporate data, dashboards will obviously need to integrated corporate systems. You need to analyze the corporate systems located in the organization and ensure that the solution will be secure and adhere to corporate security requirements.
- Target Devices: Real-time dashboards are most useful, when they are available from anywhere at any time. Therefore, enabling dashboards on mobile devices (Tablets, Smartphones) would have maximum impact.
Check out this enterprise dashboard shiny application https://denironyx.shinyapps.io/caflights15/